Analytics Dashboard Widgets — Pure SVG Charts
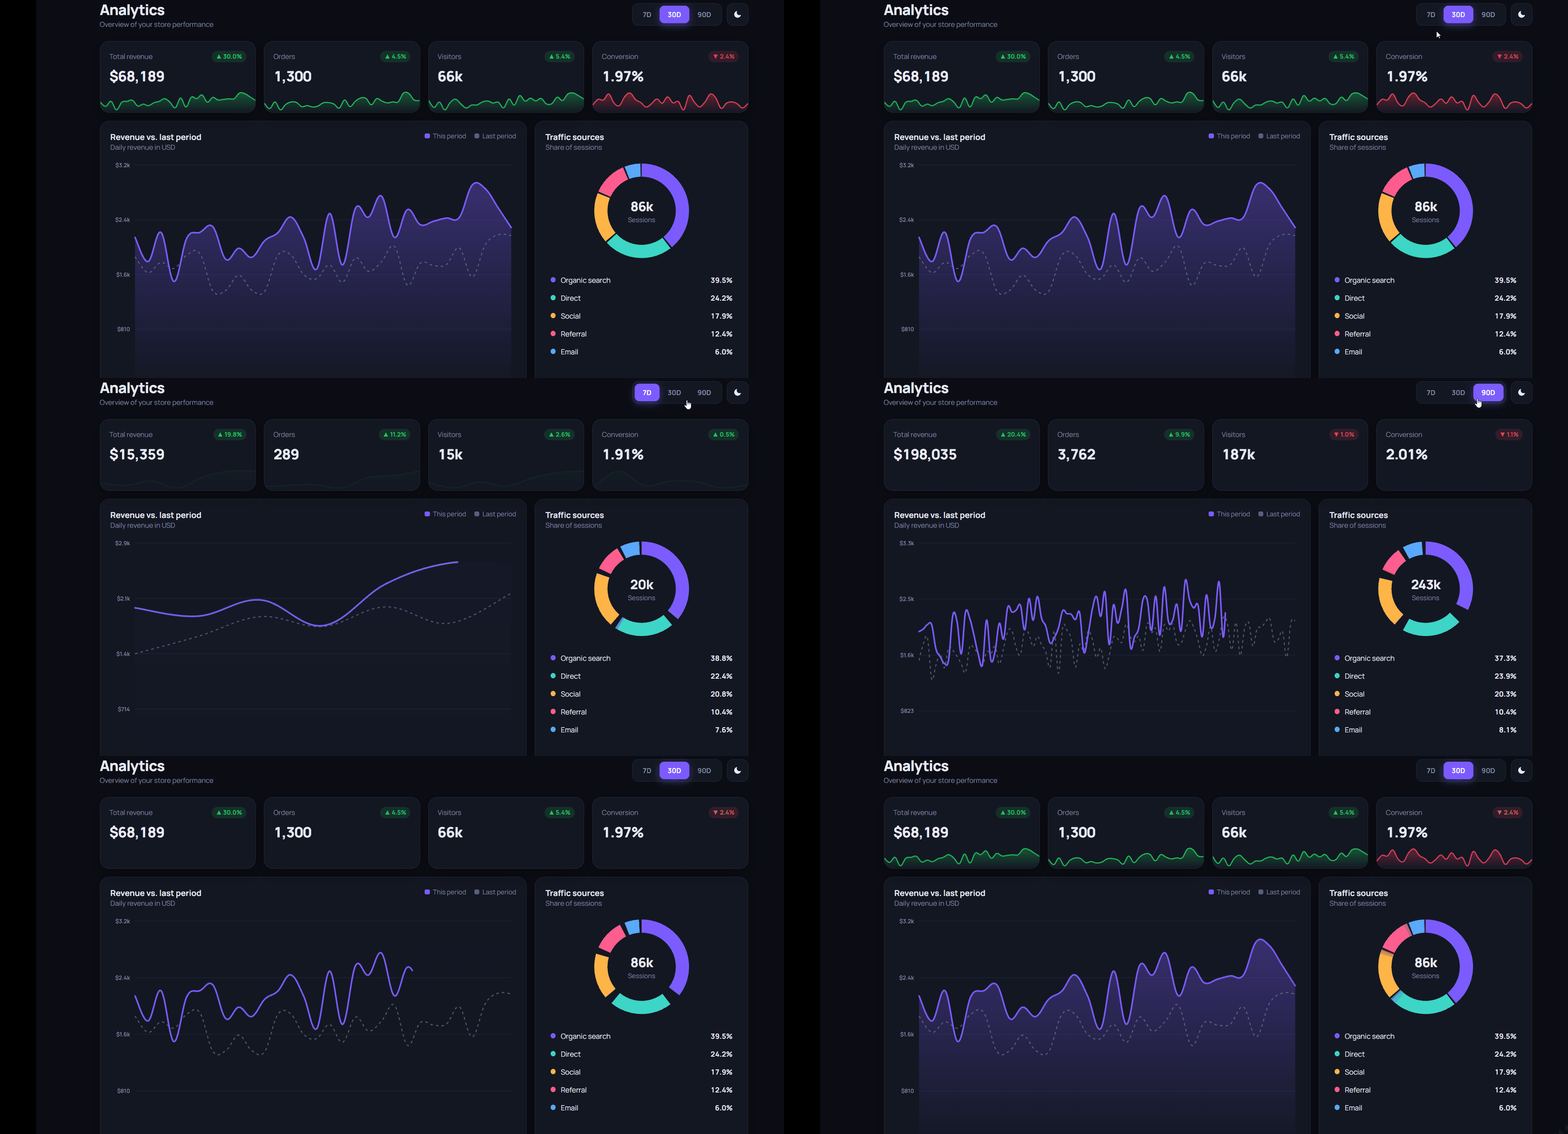
A complete analytics dashboard built without any chart library: KPI cards with sparklines, a smooth revenue line chart with crosshair tooltip, an animated bar chart, an interactive donut chart and a top-products list. Includes 7D/30D/90D range switching and a light/dark theme toggle. Pure HTML, CSS and vanilla JavaScript.
- Charts & Graphs
- dashboard
- charts
- graphs
- analytics
- data-visualization
- admin-panel
- dark-mode
Features Included
Analytics Dashboard Widgets — Pure SVG Charts
A production-style analytics dashboard where every chart is hand-drawn SVG — no Chart.js, no D3. Range switching, tooltips and dark/light theme included.
What's Included
- 4 KPI cards with change badges and sparklines
- Smooth revenue line chart vs. last period with crosshair tooltip
- Animated weekday bar chart with hover tooltip
- Interactive donut chart — hover a slice or legend item
- Top products list with animated progress bars
- 7D / 30D / 90D range switch and light/dark theme toggle
- Charts redraw on resize — fully responsive
Dependencies
- Google Fonts — Manrope https://fonts.googleapis.com/css2?family=Manrope:wght@400;500;600;700;800&display=swap
Already linked inside the component's files — no extra setup needed.
Desktop Preview
Source Code
Because this component includes several hand-drawn SVG charts, the full HTML, CSS and JavaScript run long. Instead of pasting everything here, grab the complete, ready-to-use source from GitHub:
The folder contains:
index.html— the dashboard layoutstyle.css— all styles, including light and dark themesscript.js— data, chart drawing and interactions
Download the folder and open index.html — no build step required.
Built by Meta Skill Group — copy it, use it, make it yours.
Built With
HTML5
CSS3
JavaScript
Compatibility
Found this useful?

Written by